Google Analytics is a free tool provided by Google that helps you track and analyze website traffic.It provides in-depth insights about visitors—such as where they come from, what pages they view, number of visitors, bounce rate, session duration, or conversions, and how they interact with your website.
Google Analytics gives you real-time and historical data to help improve your site's performance. It helps businesses and marketers make informed decisions based on user behavior. Google Analytics collects data using a small snippet of tracking code added to your website and shows the data on your Google Analytics dashboard.
Most websites will tell you that Google Analytics is a free tool by Google that tracks website visitors and user behavior. But let’s go beyond that.
A Real Example:
Imagine your website is a store in a mall. You open the doors, decorate the shelves, and wait for customers. But:
Do you know who entered your store?
Which product they picked up but didn’t buy?
Or whether they came from a friend’s recommendation or a billboard outside?
This is exactly what Google Analytics does—but for your website. It's not just a data tool. It’s your digital CCTV + sales assistant + marketing strategist working in the background 24/7.
Most new users think Google Analytics is about:
Counting users
Measuring sessions
Checking bounce rates
But here’s a secret rarely mentioned: Google Analytics is the most powerful marketing tool when configured correctly. By combining custom events, funnels, cohorts, and conversion paths, Google Analytics becomes more than a tracker—it becomes a customer psychologist.
You can answer deep questions like:
Why are people abandoning your form halfway
Do returning users behave differently than new ones
What’s the real reason your cart conversion dropped last week?
Google Analytics is a powerful digital analytics tool provided by Google that helps businesses, marketers, and website owners understand how people interact with their websites or apps. But its usefulness goes far beyond just counting visits or page views. Let’s explore what Google Analytics is used for in the real world, and how it helps make better decisions.
At its core, Google Analytics tracks:
Who visits your website
Where they come from (Google search, Facebook, direct typing, etc.)
What pages they view
How long they stay
What devices they use (mobile, desktop, tablet)
This data helps you understand the behavior and demographics of your audience so you can serve them better.
Google Analytics doesn’t just track “how many people” visited your site—it tells you why they visited and what they were hoping to do.
Example:
You see a blog page with 5,000 monthly visits but 90% bounce rate. That’s a signal the content didn’t meet intent. You learn more by tracking scroll depth, session time, and click patterns.
Refine your content strategy based on what real visitors are looking for—not just traffic volume.
Google Analytics allows you to track and compare different traffic sources:
Organic Search (Google, Bing)
Paid Ads (Google Ads, Facebook Ads)
Email Campaigns
Social Media
Referrals from other websites
You can see which channels are driving the most traffic, which ones convert better, and where to invest more marketing budget.
One of the most valuable uses of Google Analytics is tracking Key Events. A "Key Events" can be:
A product purchase
Filling out a contact form
Downloading a brochure
Subscribing to a newsletter
You can set up these actions as Key Events and measure how many users complete them.
Think of your website like a funnel:
Home → Product Page → Cart → Checkout → Payment
Where are users dropping off?
GA lets you set up conversion paths to spot where people are bouncing and where they’re converting.
Use Case: Improve revenue by identifying and fixing drop-off points in your funnel.
You don’t talk the same way to a teenager and a business owner, right?
GA lets you segment users based on:
Demographics (age, gender, location)
Traffic source (Google, Instagram, Email)
Device (mobile vs desktop)
Behavior (engaged vs non-engaged)
Use Case: Create targeted landing pages, email campaigns, or offers for different audience types.
People think conversions mean sales. But in modern marketing, micro-conversions are often more valuable:
Time on page > 3 mins
Watched 50% of a video
Scrolled 75% of a blog
Clicked “Contact Us”
Viewed a pricing table
Use Case: Identify warm leads before they even reach the cart.
A simple change like shifting your CTA button above the fold can improve your conversions.
Google Analytics helps you:
Compare page performance over time
Run A/B tests (when linked with Optimize or Looker Studio)
Identify underperforming pages
Use Case: Make design or content decisions based on real user behavior, not guesswork.
You might be spending money on Google Ads, social media, SEO, and email—but do you know which channel is:
Bringing the most traffic?
Getting the most engaged users?
Delivering conversions?
GA’s Acquisition Reports break this down beautifully.
Use Case: Reallocate marketing budget to high-performing channels.
Sudden drop in mobile traffic? 100% bounce rate on a landing page?
GA tells you when something breaks—before your users do.
Use Case: Detect bugs, slow loading pages, or broken forms early.
Creating a Google Analytics account is the first step to start tracking your website or app visitors. Whether you're a business owner, blogger, marketer, or developer, this guide will walk you through the entire process of How to Create a Google Analytics Account?
Step 1: Sign in to Google Analytics

Visit this website https://marketingplatform.google.com/about/analytics/ and then click on the Sign in to Analytics button. If you already have a Google Analytics account, it will appear, but if you are creating a new account for the first time, a screen will appear to fill in the business details
Step 2: Click on “Start Measuring” to Begin Setup
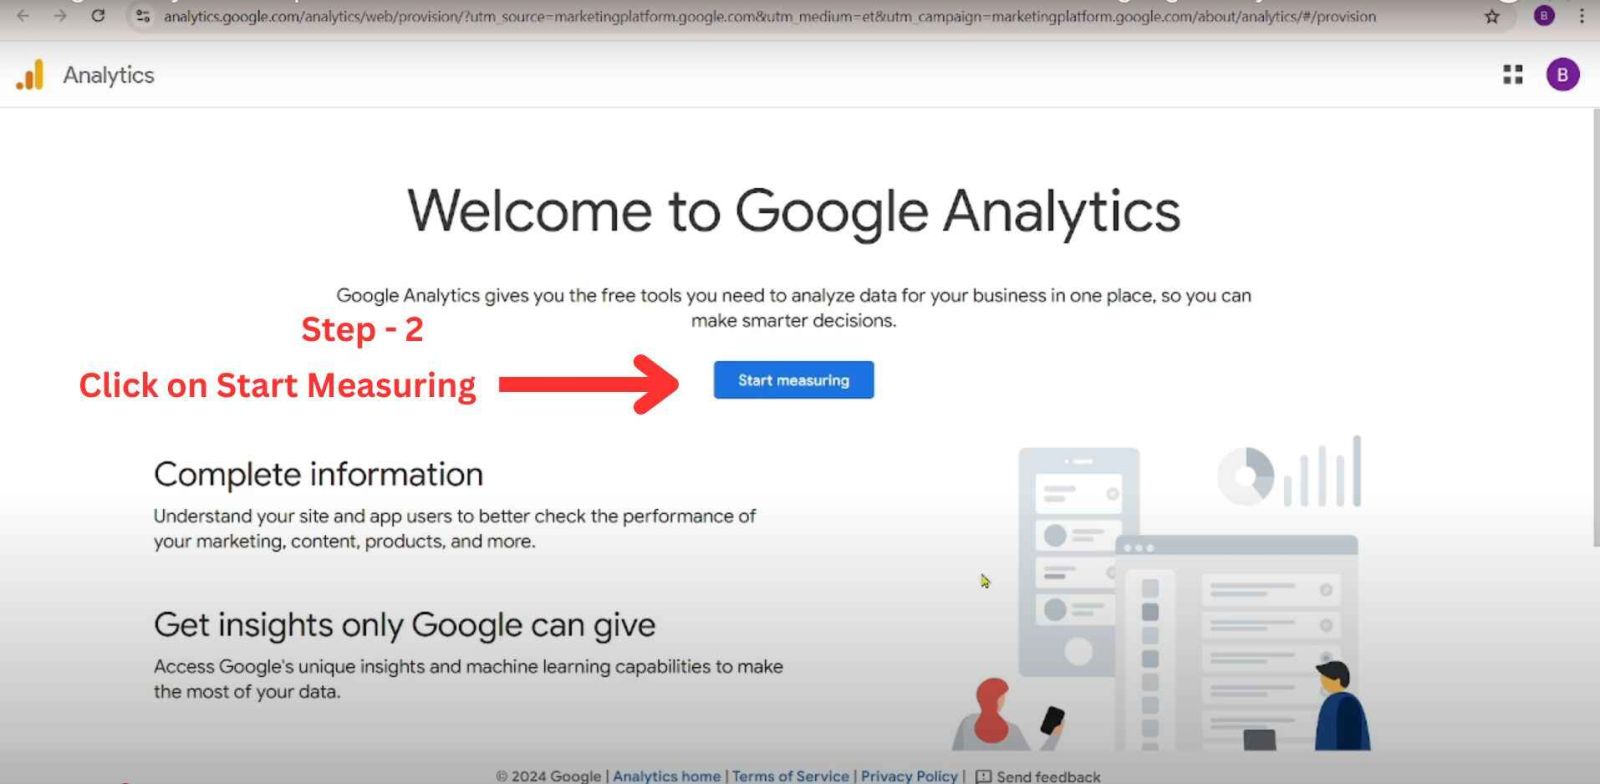
Click on “Start measuring” to continue. This will take you to the next screen where you’ll enter your Account Name and choose basic settings.
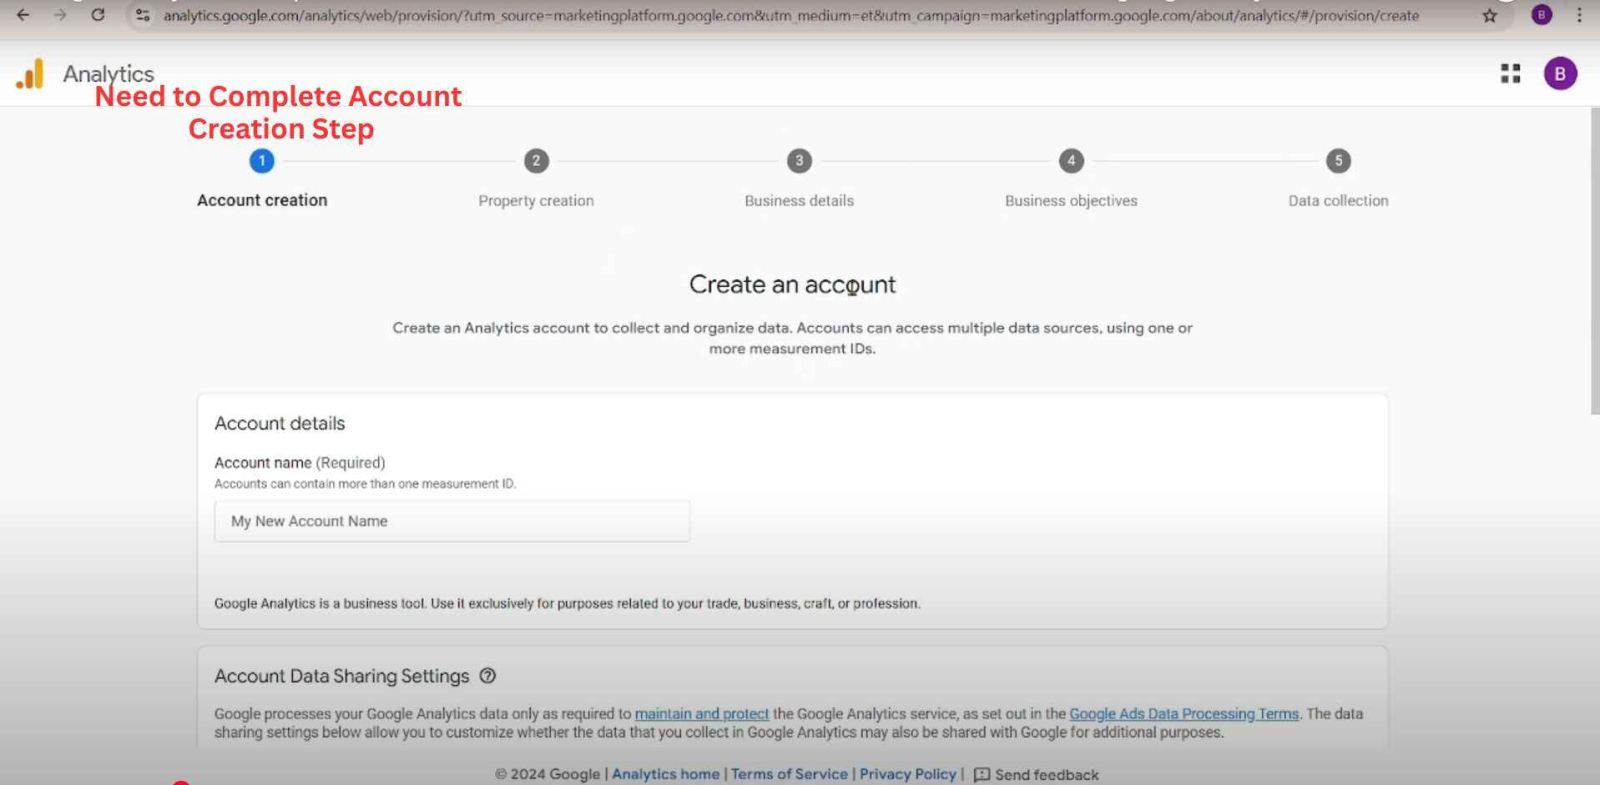
Once you click the “Start measuring” button, you’ll reach the Account creation screen. This is where you officially begin the process of setting up your Google Analytics account.
A Google Analytics account acts as the container for all the properties (websites or apps) you want to track. You can manage multiple properties under one account, so if you have more than one website, you don’t need to create separate Google logins.
Fill in Your Account Details: You’ll now see a field labeled:
Account Name : Here, you should enter a name that clearly identifies the business or project you’re tracking. For example: DigiTechGrow. This name is only visible to you and your team. Choose something meaningful so it’s easy to recognize later if you have multiple accounts.
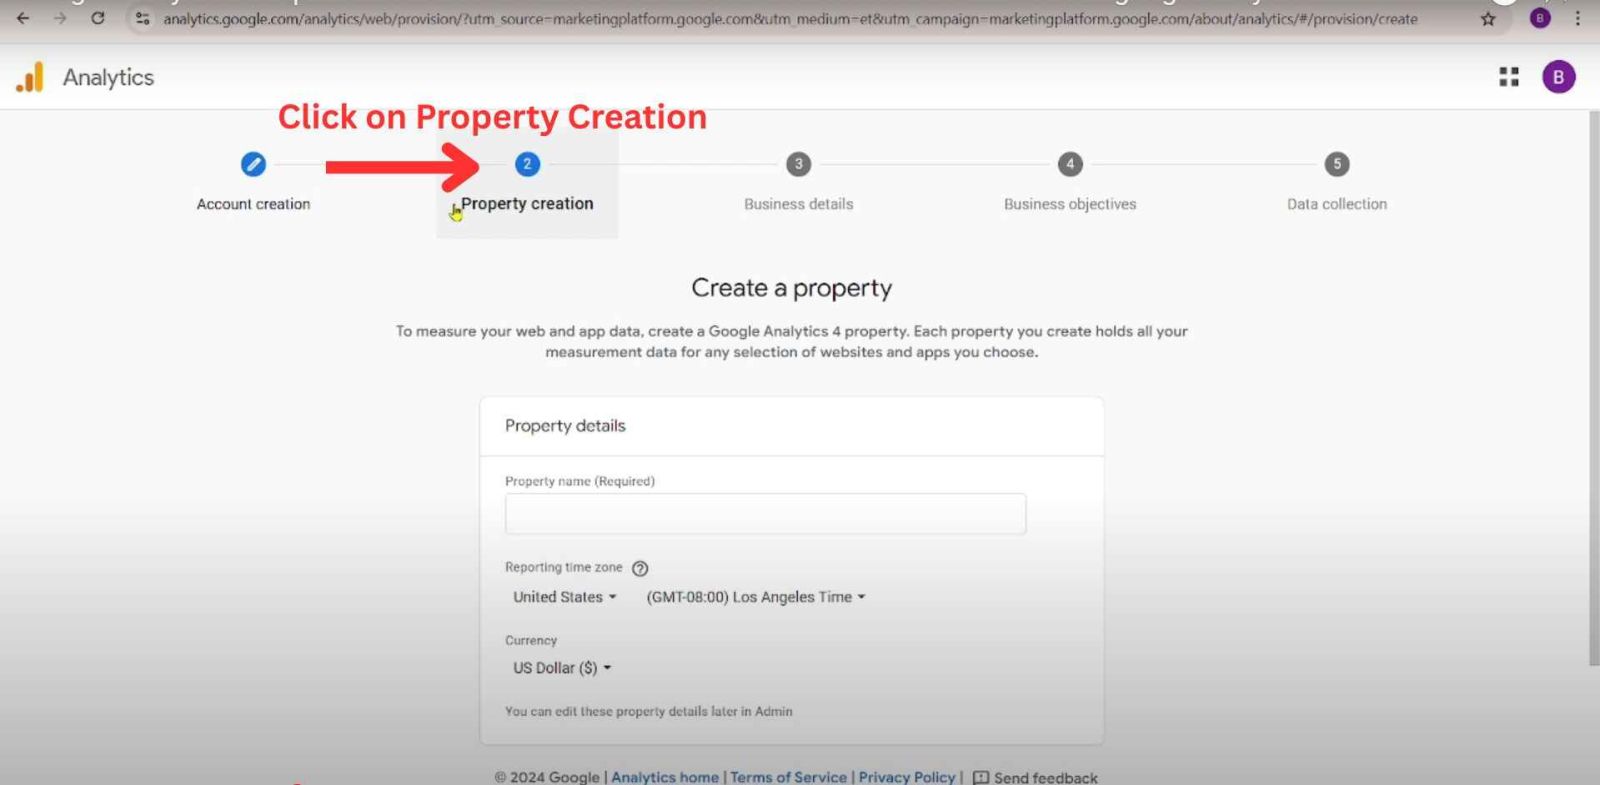
After setting up your account, the next step is to create a Property — this is where your actual website or app data will be collected and analyzed.
In simple terms, a property represents the specific website, app, or digital platform you want to track.
For example: If you are tracking www.example.com, then that is your property. If you're tracking both a website and a mobile app, you might have two properties under one account. Google Analytics 4 (GA4) allows each property to handle multiple data sources like websites and apps in one place.
Fill in Property Details - On this screen, you’ll be asked to enter:
Property Name - Enter the name of the website, app, or project you're tracking.
Example: digitechgrow or as per your requirement
Reporting Time Zone - Select the time zone based on your business or audience location.
Example:
India: (GMT+05:30) India Standard Time
USA: (GMT-08:00) Los Angeles Time
This setting affects how data is grouped by day in your reports.
Currency :Choose the currency relevant to your business. For Indian websites, you can select INR - Indian Rupee (₹). This is useful if you’re tracking ecommerce revenue. Once you've filled out all three fields, click the “Next” button to move to the Business Details section.
Step 3: Describe Your Business
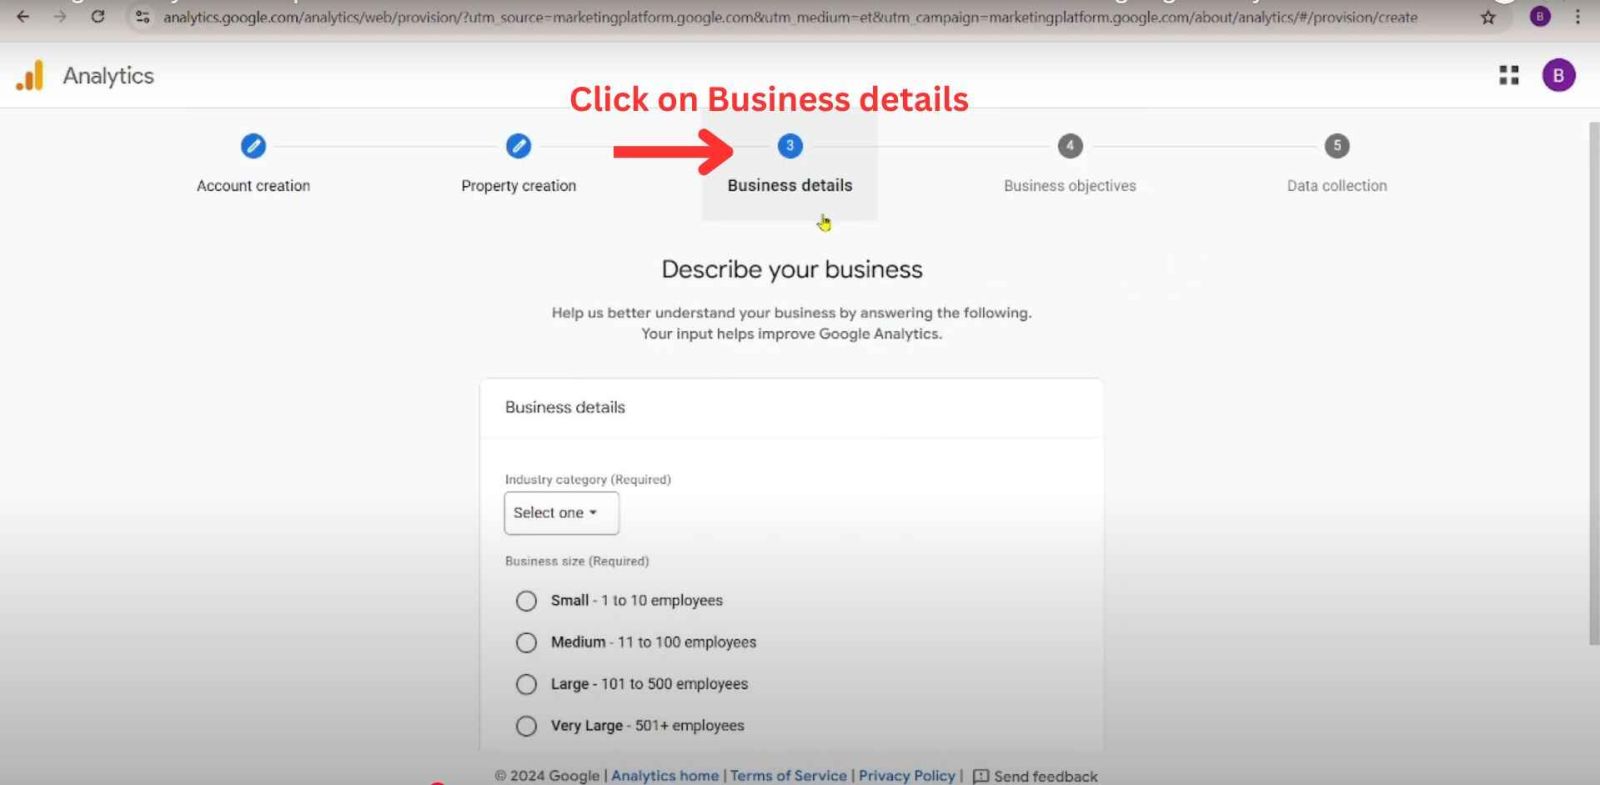
Once you've created your property, the next step is to provide a few details about your business. This helps Google Analytics offer tailored insights and recommendations that are more relevant to your industry and business size.
You’ll now see a screen titled Describe your business with two required fields:
1. Industry Category
Use the dropdown to select the industry that best represents your business. This helps Google group your data appropriately and offer benchmarking reports.
Some common examples include:
Retail
Travel
Healthcare
Real Estate
Finance
Technology
Education
Other
If you're unsure, just select "Other" to move forward.
2. Business Size
Next, you’ll be asked to select your business size based on the number of employees:
Small – 1 to 10 employees
Medium – 11 to 100 employees
Large – 101 to 500 employees
Very Large – 501+ employees
This doesn’t impact how your data is tracked — it's only for internal suggestions and improving Google Analytics features for your type of business. Once you've selected both options, click the “Next” button to move to the next step: Defining your business objectives.
Step 4: Choose Your Business Objectives
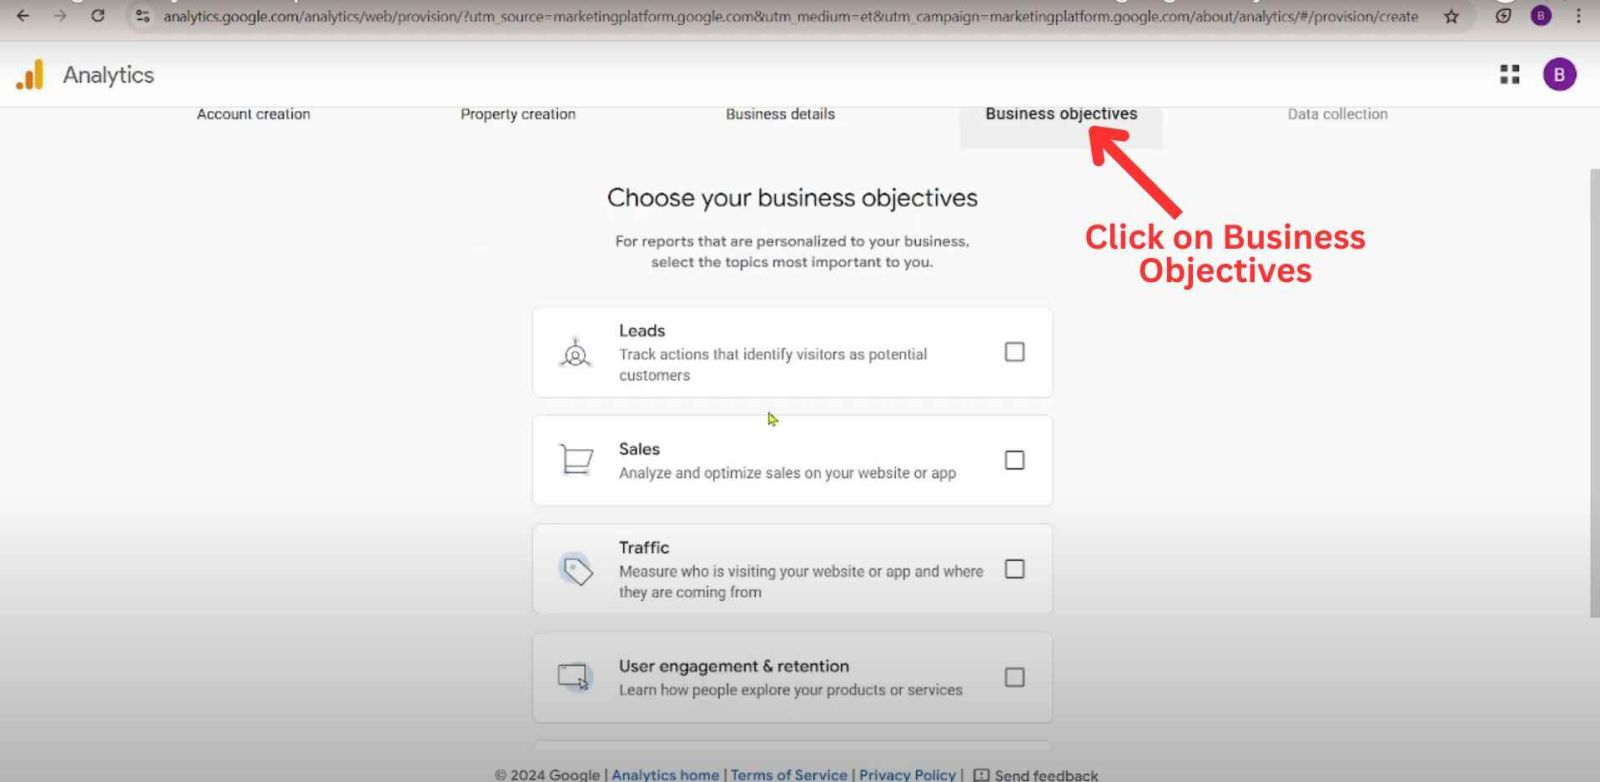
In this step, Google Analytics gives you the option to personalize your reports based on your business goals. This helps the platform recommend the most relevant features, reports, and insights. You’ll see a section titled “Choose your business objectives” with multiple checkboxes.
Why Is This Important?
By selecting one or more goals, Google Analytics tailors the dashboard experience so that you get the most meaningful data right from the beginning — whether you're tracking leads, monitoring user behavior, or analyzing sales.
Leads - Use this if You want to track form submissions, sign-ups, or inquiries from potential customers and your goal is to Identify high-intent visitors.
Sales - Use this if You run an e-commerce website or sell services online and your goal is to Track transactions, revenue, and optimize your sales funnel.
Traffic - Use this if You want to measure how many people visit your site, where they come from, and what devices they use. Choose this if your goal is to understand visitor sources and behavior.
User Engagement & Retention - Use this if You're focused on how users interact with your content, pages, or app over time. Behind this business objective your goal is to Improve session duration, bounce rate, and returning user activity.
Pro Tip: If you're unsure which one to choose, start with “Sales” or “Leads”. You can always customize your goals later. Once you've selected your objectives, click on the “Next” button to proceed to the final setup: Data Collection Configuration.
Step 5: Accept Google Analytics Terms of Service
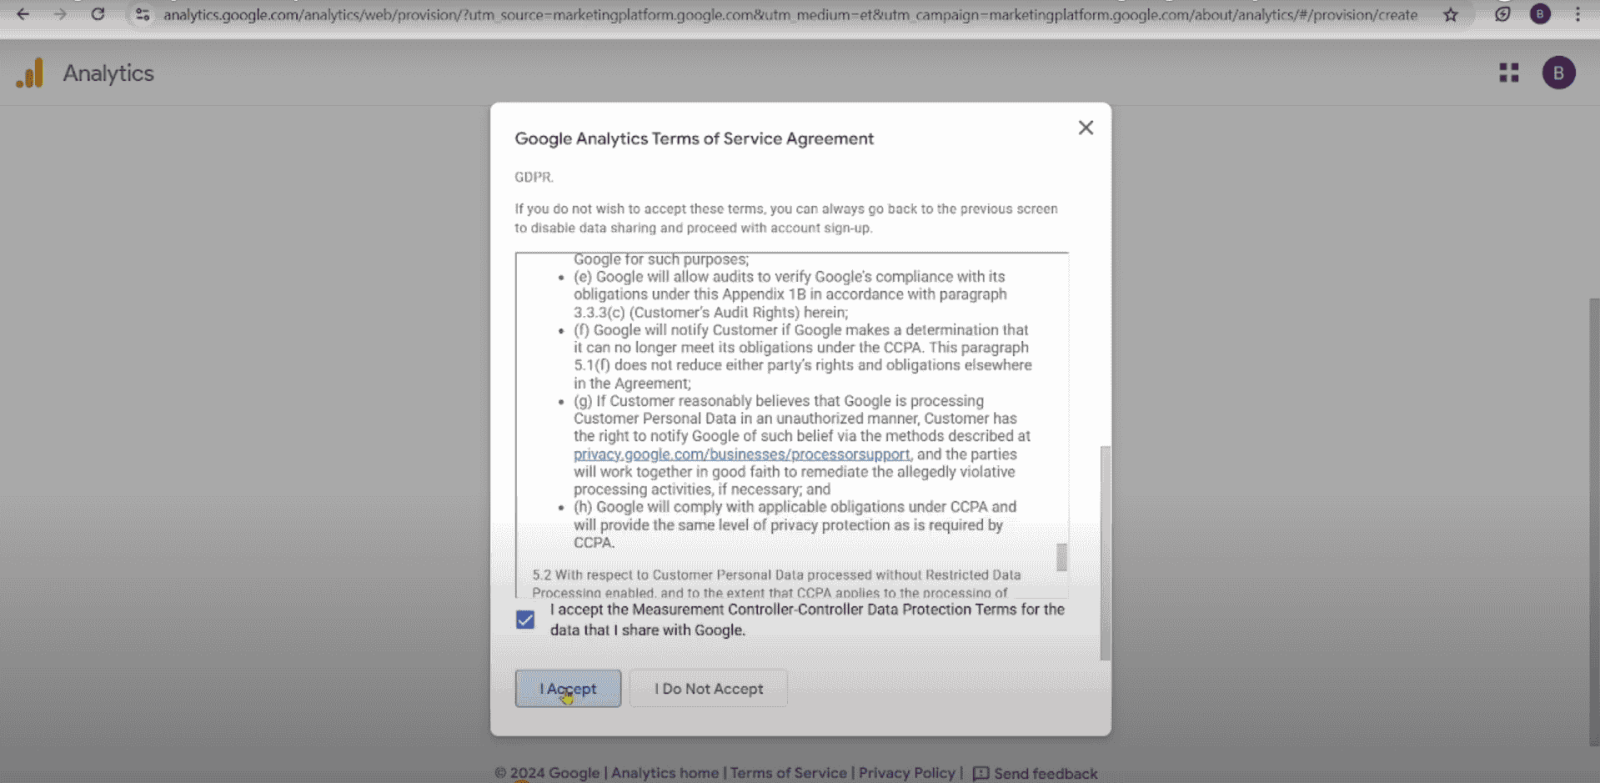
Once you've selected your business objectives, Google will prompt you to review and accept the Google Analytics Terms of Service Agreement. This step is mandatory and ensures that you understand and agree to how your data will be processed and used in compliance with international privacy laws like GDPR and CCPA.
What You’ll See:
A popup window titled “Google Analytics Terms of Service Agreement” will appear. It includes:
Legal terms about data collection and processing.
Google's responsibilities under GDPR and CCPA.
A checkbox stating:
“I accept the Measurement Controller–Controller Data Protection Terms…”
What You Need to Do:
Scroll through the terms if you want to review them. Make sure the checkbox at the bottom is ticked.
Click on the “I Accept” button to proceed.
Note: Accepting these terms is required to continue using Google Analytics. You won’t be able to proceed without this step.
Once accepted, you’ll move on to the next and final step, where you’ll start configuring your data collection stream — such as setting up tracking for your website or app.
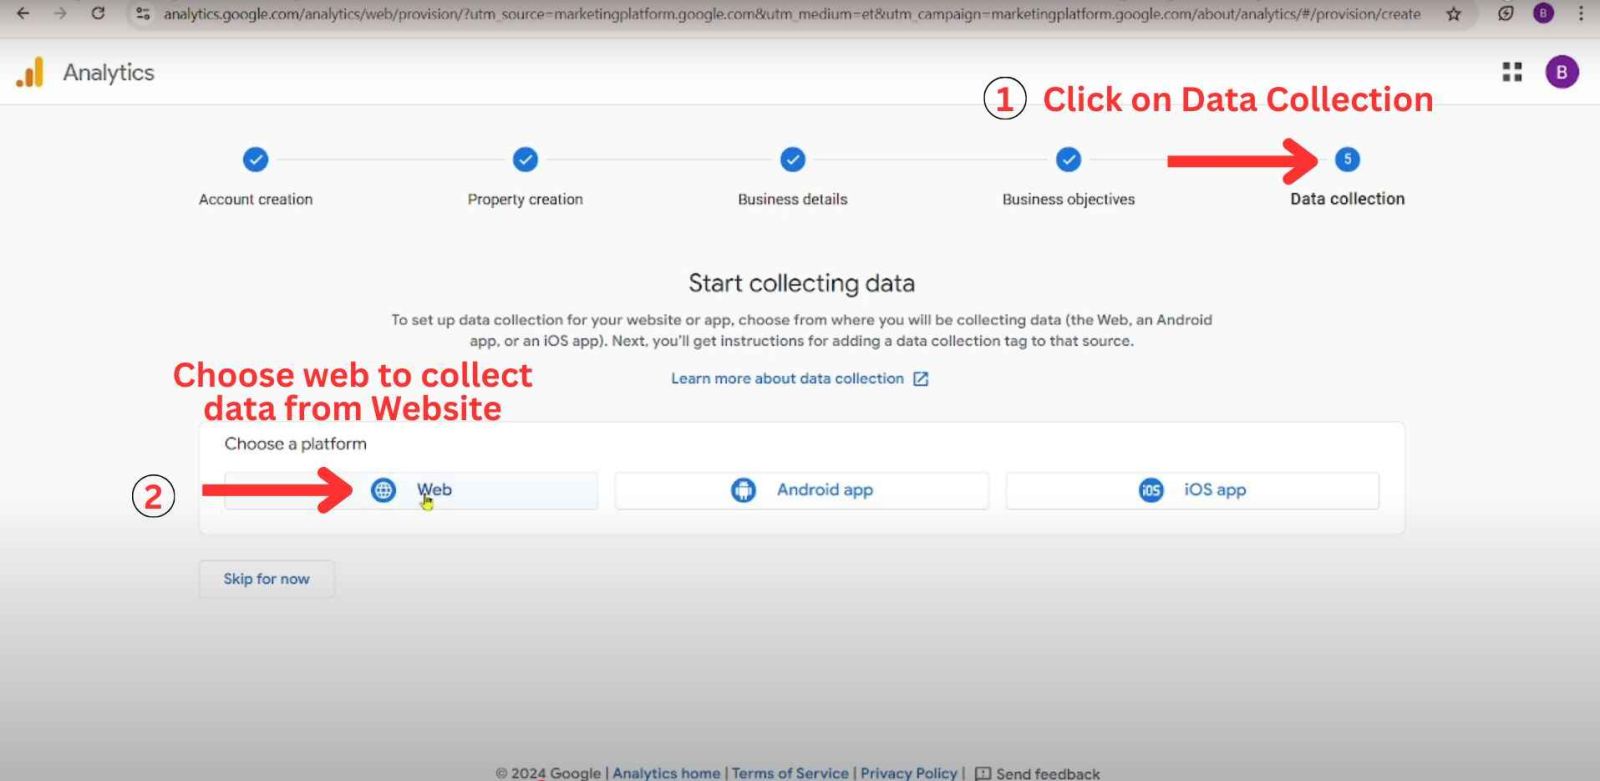
Now it’s time to connect your website to Google Analytics so it can start collecting data from your visitors.
Set Up Your Web Stream
You’ll now see a screen titled “Set up data stream.” This is where you’ll link your website and name the stream.
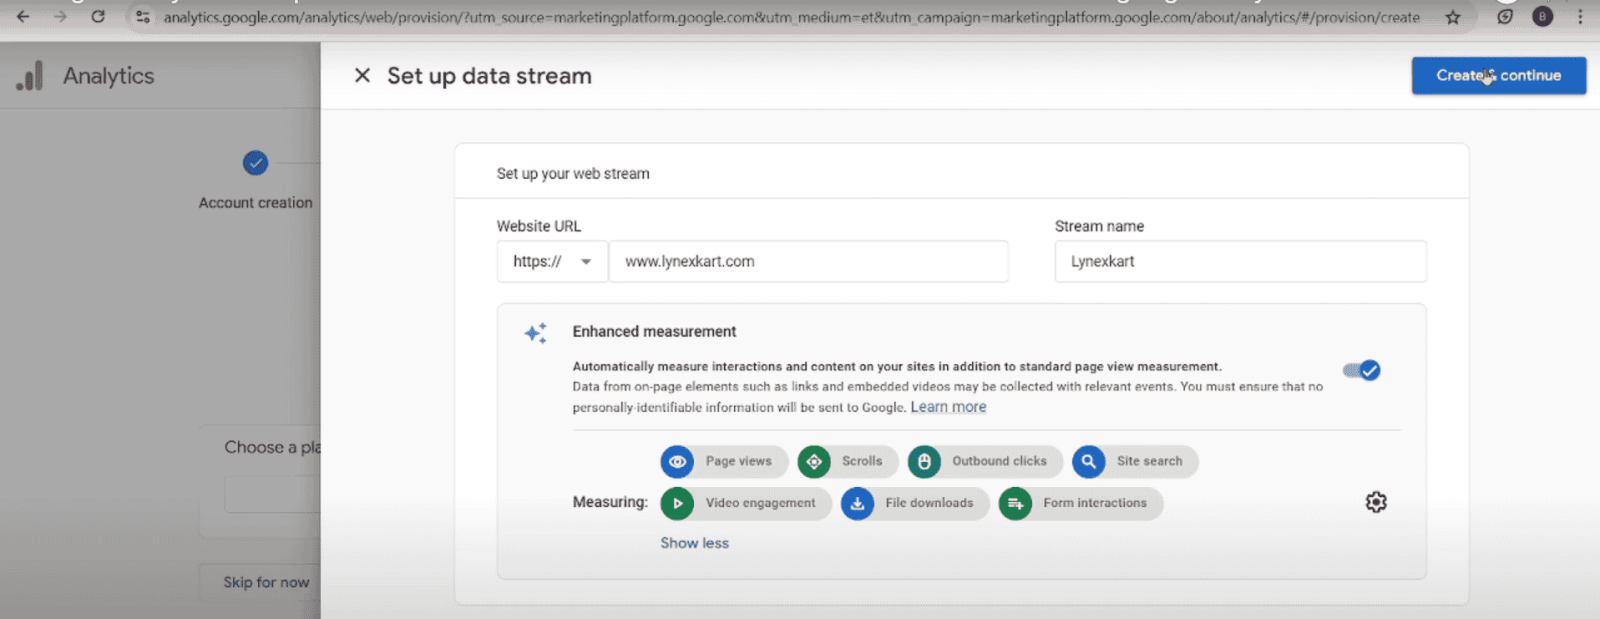
Fill in the Required Details:
Website URL - Enter the full domain name of your website. Example: www.digitechgrow.com
Stream Name - Give your stream a name for easy identification (like your website or brand name). Example: DigiTechGrow
Enhanced Measurement automatically tracks important visitor actions like:
Page views
Scrolls
Outbound link clicks
Site search
Video engagement
File downloads
Form interactions
This option is enabled by default. You can leave it turned on to get detailed data without extra setup.
Click the “Create stream” or “Create & continue” button at the top right to move forward. Once you proceed, you’ll receive a Measurement ID and a tracking code that needs to be installed on your website.
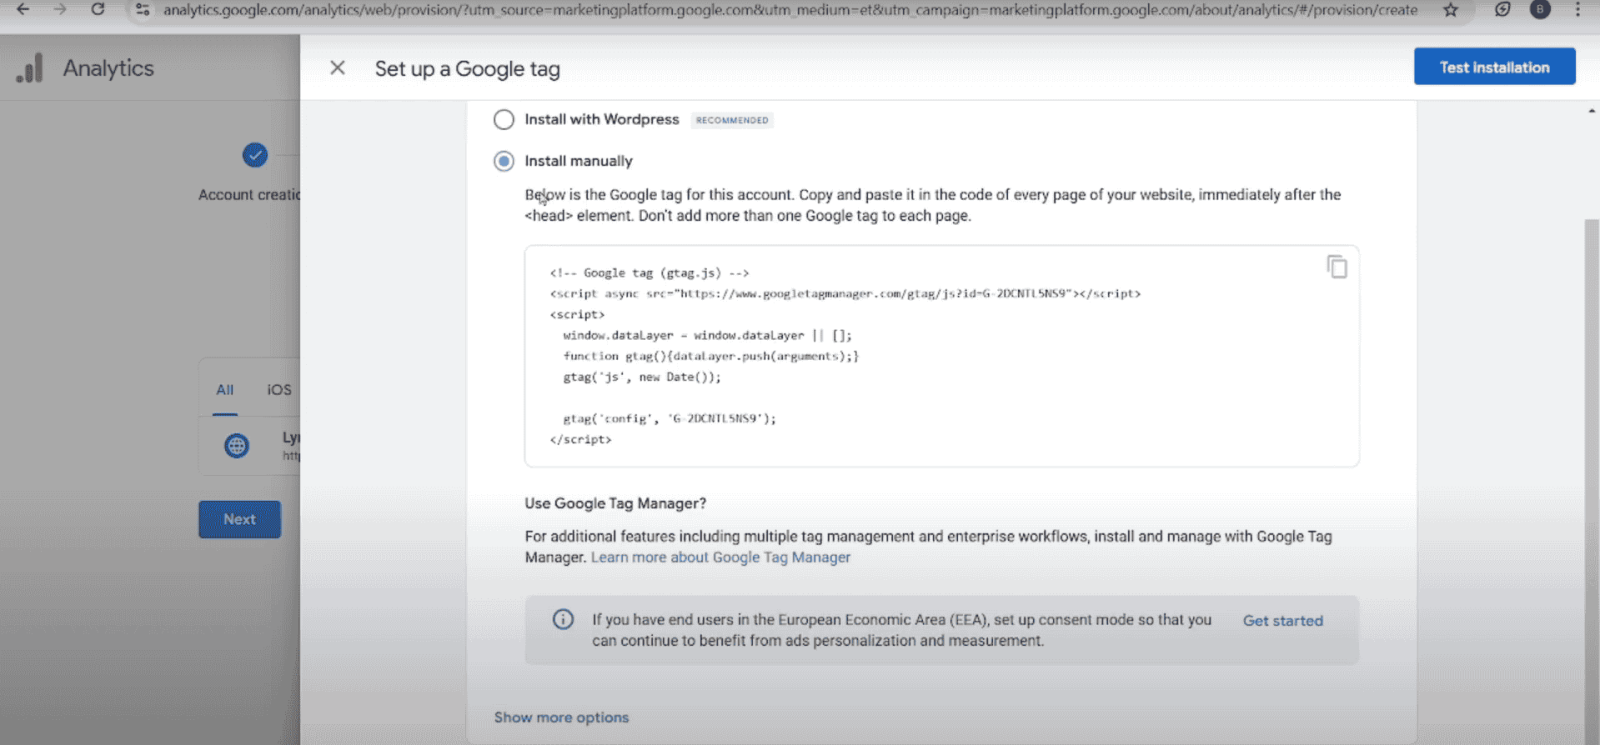
Now your data stream is ready, you need to connect Google Analytics with your website. This allows Analytics to track visitor behavior on your site. You’ll See This Screen: “Set up a Google tag”
There are two installation options:
Install with WordPress – for users using WordPress websites with plugins.
Install manually – best for custom-coded websites or where you want full control.
We’ll go with this option in this guide.
Manual Installation Instructions:
You’ll see a script like this:
<!-- Google tag (gtag.js) -->
<script async src="https://www.googletagmanager.com/gtag/js?id=G-XXXXXXXXXX"></script>
<script>
window.dataLayer = window.dataLayer || [];
function gtag(){dataLayer.push(arguments);}
gtag('js', new Date());
gtag('config', 'G-XXXXXXXXXX');
</script>
Paste the Tag on Your Website:
Open your website's code or header template. Paste the copied code just before the closing </head> tag. Save and upload the changes.
If you're using WordPress, paste this into your theme’s header.php file or use a plugin like “Insert Headers and Footers.”
Optional: Test Installation
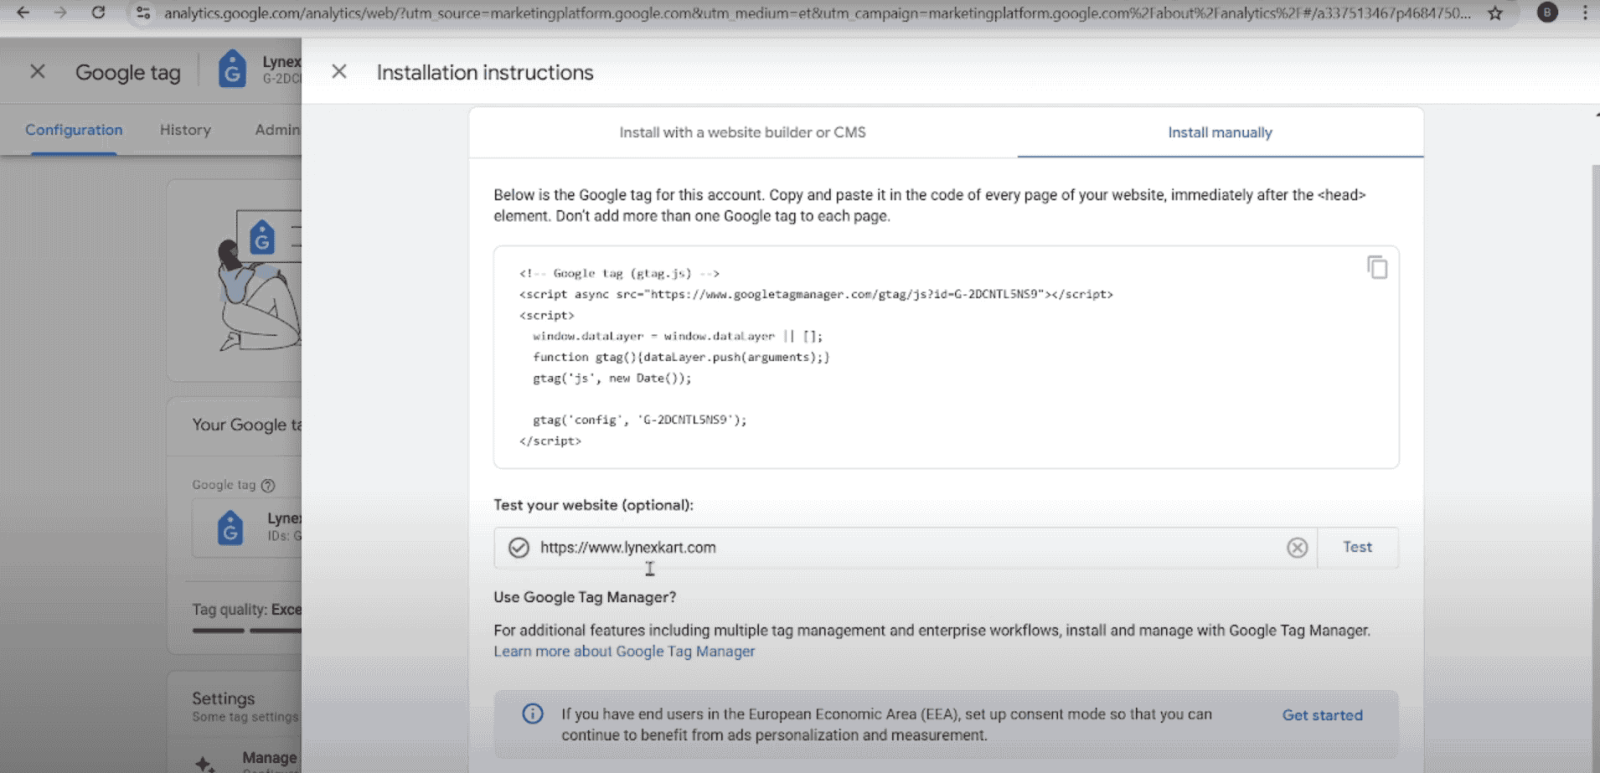
Click the “Test installation” button to confirm if your tag is working correctly. Once the tag is added and live, Google Analytics will begin collecting data from your website visitors. Congratulations! You’ve successfully Created your Google Analytics account and property.
WordPress is the most popular CMS, and there are multiple ways to add GA4 Google Analytics to a WordPress site. The two most common methods are:
This is the easiest way for beginners who don’t want to touch code. If you’re using WordPress, the easiest way to connect Google Analytics 4 (GA4) is by using the Site Kit by Google plugin. It’s free, beginner-friendly, and automatically integrates GA4 with your website.
Here’s a step-by-step guide:
Step 1: Install the Site Kit Plugin
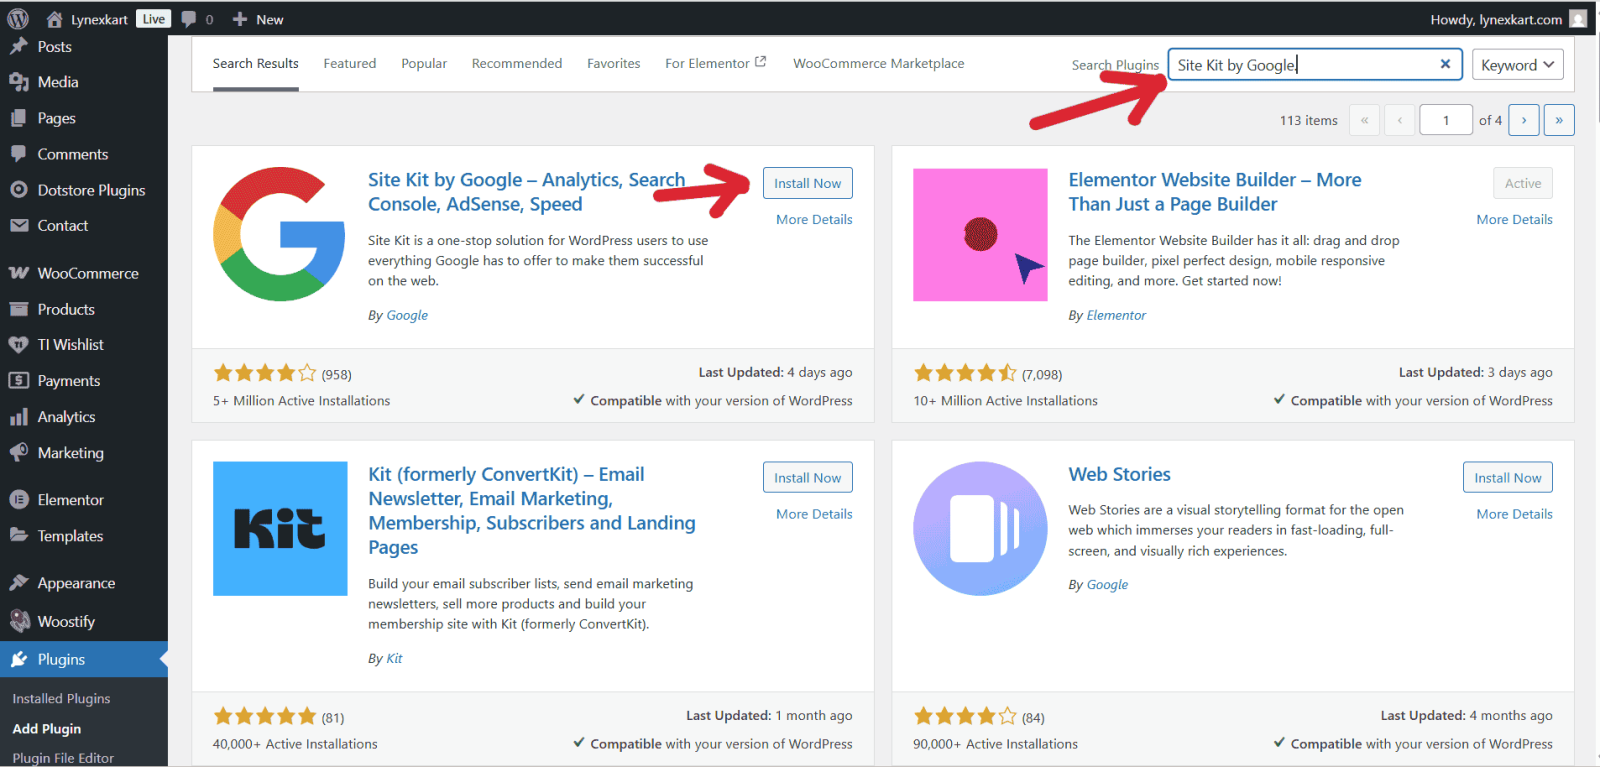
Open your WordPress dashboard and Make sure your site is live (not in maintenance mode or password-protected).
From the left-hand menu, go to Plugins > Add New.
In the search bar, type Site Kit by Google. You will see the plugin named Site Kit by Google – Analytics, Search Console, AdSense, Speed (by Google). Click Install Now, then click Activate once the installation finishes.
Step 2: Set Up Site Kit
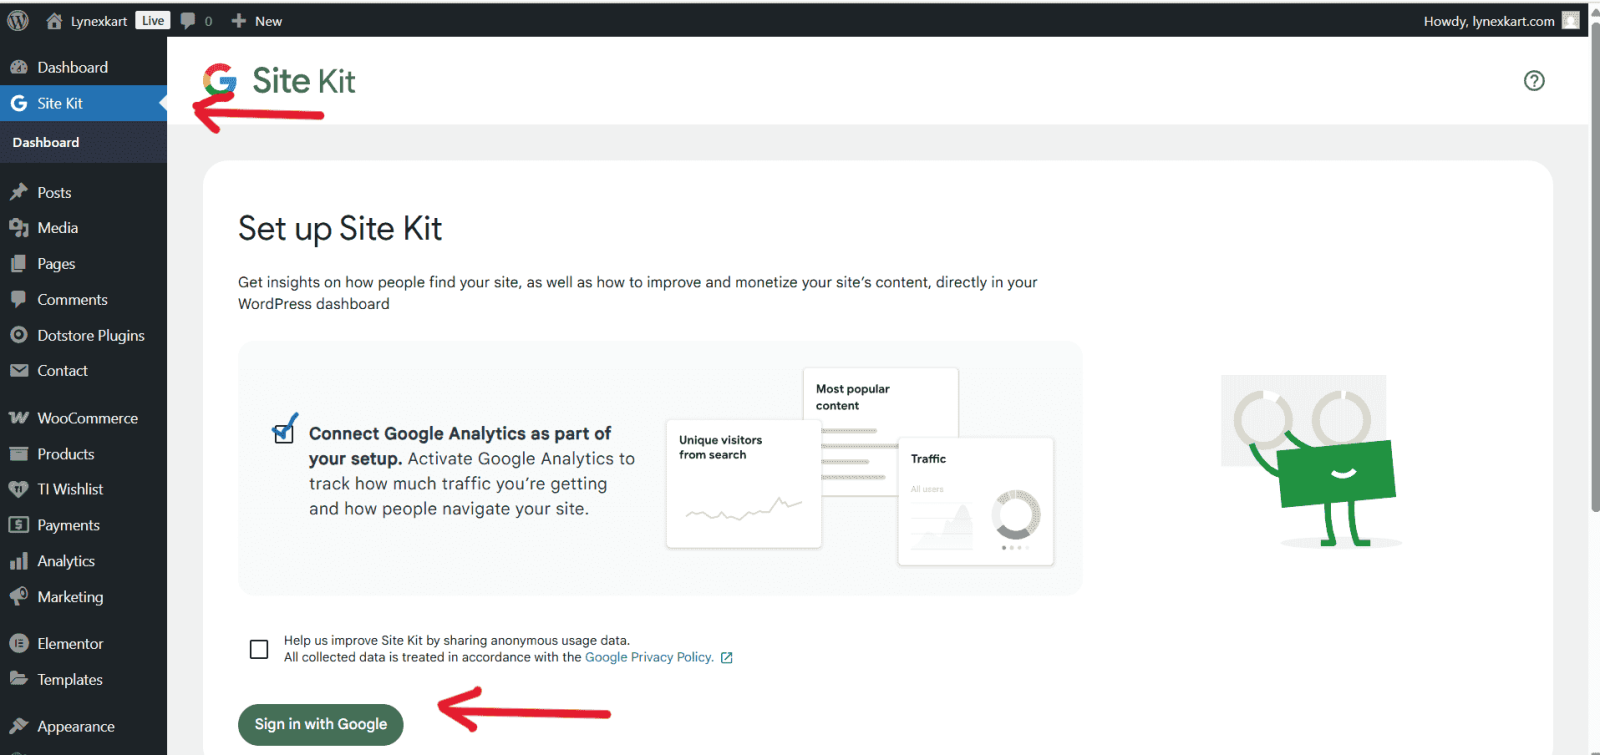
Once the Site Kit plugin is installed and activated, you will now see the Site Kit option on the left-hand menu. Click on it.
Check the option “Connect Google Analytics as part of your setup.”
Click Sign in with Google.
Step 3: Connect Your Google Account
.png)
Choose the Google account that already has your GA4 property set up.
Allow the requested permissions so Site Kit can access your data.
%20(1).png)
Verify your site ownership when prompted
Click Add site to connect your website with Google Search Console as well (recommended
Step 4: Link Google Analytics
.png)
After granting permissions, Site Kit will show you the available Google Analytics 4 accounts linked to your Google account.
In the Account dropdown, choose your Google Analytics account (example: Lynexkart).
In the Property dropdown, select your Google Analytics 4 property.
In the Web Data Stream dropdown, choose the stream created for your website.
Make sure you select the correct GA4 property that you created for your WordPress site. Once selected, click the Complete Setup button.
Now, Google Analytics 4 is successfully connected to your WordPress website. Site Kit will automatically insert the tracking code, so you don’t need to add it manually.
Step 6: Test Your Connection
Open your website in a new tab
Go to your Google Analytics dashboard → Realtime reports
If you see your visit being tracked, congratulations — GA4 is successfully connected!
If you don’t want to use a plugin, you can connect GA4 to your WordPress site by adding the tracking code manually. This method is lightweight and doesn’t rely on third-party plugins, but it requires you to edit your theme files carefully. Here’s how to do it:
%20(1).png)
Log in to your Google Analytics account.
Go to Admin > Data Streams > Web.
Select your website data stream.
First Log in to your Google Analytics account and Go to Admin > Data Streams > Web. Select your website data stream. Under Google Tag, click view tag instruction. After that you will see two options click on Install Manually and you will get Google Tag.
%20(1).png)
Copy the code snippet provided.
It will look something like this:
<!-- Google tag (gtag.js) -->
<script async src="https://www.googletagmanager.com/gtag/js?id=G-XXXXXXXXXX"></script>
<script>
window.dataLayer = window.dataLayer || [];
function gtag(){dataLayer.push(arguments);}
gtag('js', new Date());
gtag('config', 'G-XXXXXXXXXX');
</script>
.png)
Log in to your WordPress admin panel.
From the left menu, go to Appearance > Theme File Editor.
On the right side, select the header.php file (because this is where we place scripts that should load on every page).
Locate the closing </head> tag inside header.php.
Paste the GA4 code just before </head>.
Click Update File to save changes.
Step 4: Verify the Installation
Open your website in a new tab.
Go back to Google Analytics → Realtime Report.
If you see your visit appearing, the setup is working correctly.
That’s it! You’ve manually added GA4 tracking code to your WordPress site.
Before you begin, if you need instructions on how to create a Google Tag Manager (GTM) Account or connect it to your website, you can refer to our detailed guide here: How to set up Google Tag Manager
Step 1: Copy Your GA4 Measurement ID
Log in to your Google Analytics account.
Navigate to Admin > Data Streams > Web.
Click on your data stream and copy the Measurement ID (looks like G-XXXXXXXXXX).
Step 2: Create a New Tag in GTM
.png)
In GTM, go to Tags > New.
Enter Tag Name - Click on the text "Untitled Tag" at the top and give your tag a clear name, such as "GA4 - Configuration Tag" or "Google Tag - G-XXXXX".
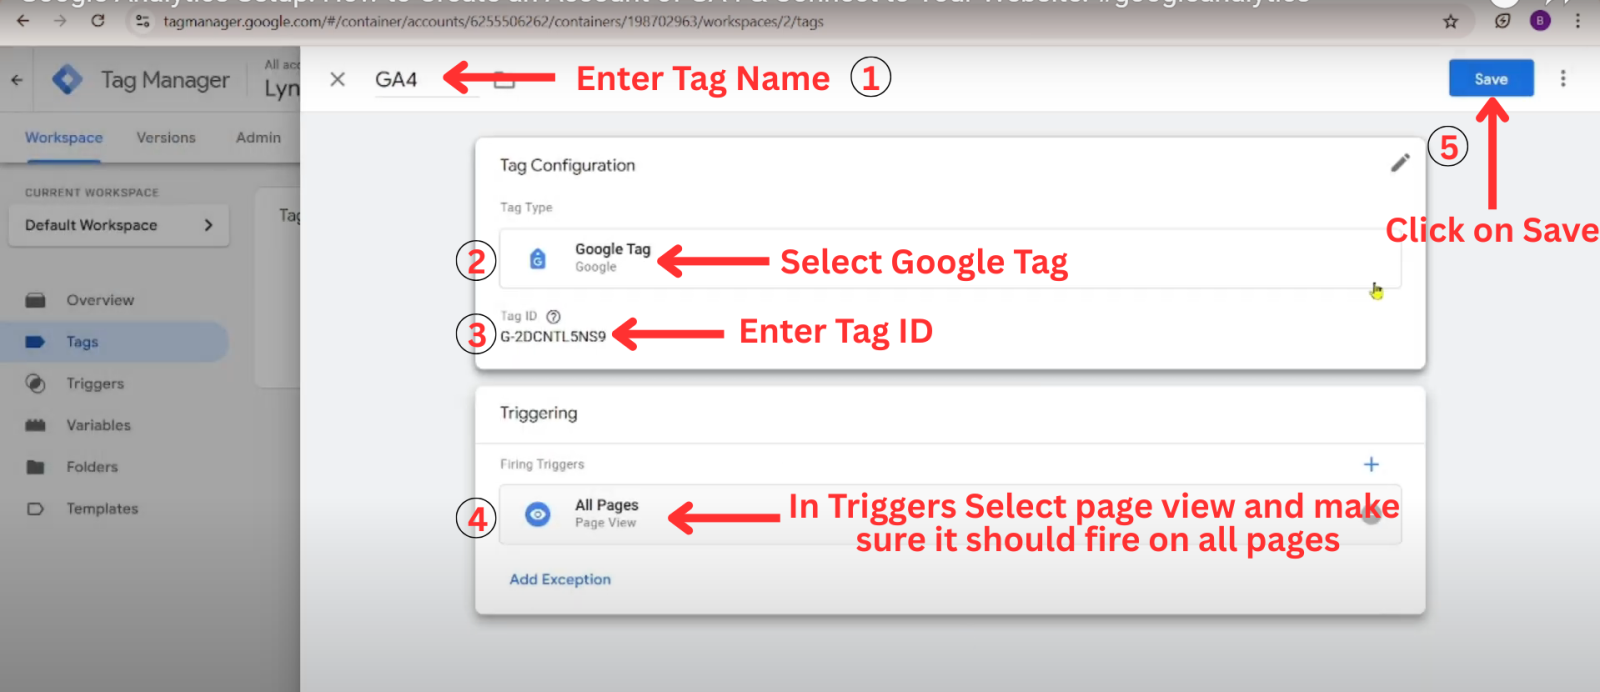
Select Tag Type - Click on the Tag Configuration box, then choose Google Tag from the list of tag types.
Enter Tag ID - Paste your GA4 Measurement ID (the one that starts with G-) into the Tag ID field.
Step 3: Configure the Trigger (When to Fire the Tag)
The Trigger tells GTM when to activate (or "fire") the tag on your website. Select All pages (Page View) as your trigger type. Click on the Triggering box and select the built-in trigger: All Pages. This ensures that the basic Google Tag is loaded on every single page of your website, which is essential for accurate analytics.
Once the Tag Configuration and Trigger are set, click the Save button in the top right corner
Step 4: Publish Your GTM Container
In the top-right corner, click Submit.
Add a version name like “GA4 Setup” and click Publish.
Your GA4 tag is now live on your site via GTM.
Step 5: Test Your Setup
Open your GTM dashboard and click Preview.
Enter your website URL → it will open in debug mode.
Check if your GA4 configuration tag is firing correctly.
You can also check in Google Analytics → Realtime Report to confirm your visit is being tracked.
Done! You’ve successfully connected Google Analytics 4 using Google Tag Manager.
<span style="\\"background-color:transparent;" color:rgb(0,="" 0,="" 0);="" font-family:arial,sans-serif;="" font-size:11pt\\"="">After connecting GA4 to your website, the most important step is to test whether it’s actually collecting data. Many times, people add the tracking code but forget to verify, which leads to missing or inaccurate reports later. Here are three reliable methods to test if GA4 is working properly:
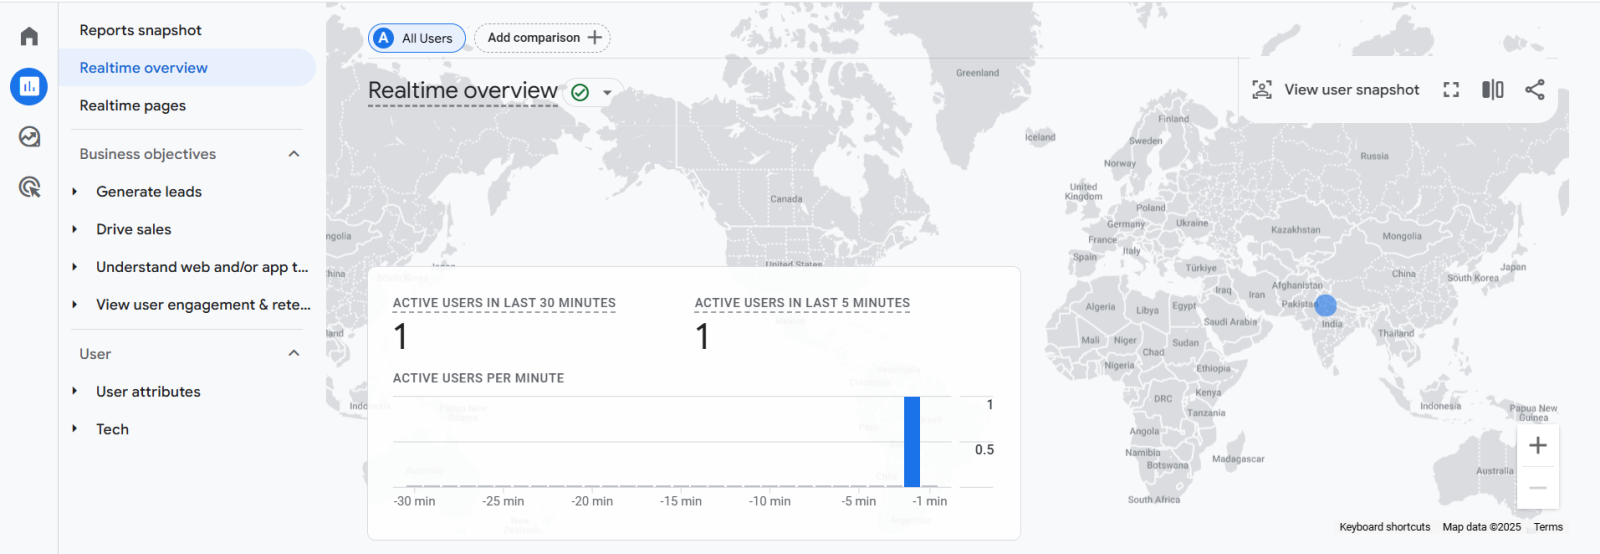
Log in to your Google Analytics account. From the left-hand menu, click on Reports > Realtime. Open your website in another browser tab (or use incognito mode). If GA4 is set up correctly, you should immediately see your visit show up in the Realtime report (e.g., "1 active user"). This is the quickest way to confirm that GA4 is tracking.
Everything you need to know about Google Tag Manager, from basics to advanced implementation
Sign in at analytics.google.com, click “Start measuring,” create an account, add a property, set up a data stream, and install the tracking code on your website.
Yes, GA4 is completely free to use
Yes, you must have a Google account login in browser to create and access GA4.
It’s a unique identifier (like G-XXXXXXX) used to connect your website or app with your GA4 property.
Yes, you can create multiple properties within the same GA4 account to track different websites.

Grow your business with best performance marketing strategy
© 2024 DigiTechGrow. Developed by DigiTechGrow.